Unleashing Customer Insights: A Guide to RFM Analysis Using Power BI
Introduction
Understanding your customers is crucial for any business looking to thrive in today’s competitive landscape. One powerful method for customer segmentation and analysis is the RFM model — Recency, Frequency, and Monetary. In this guide, we’ll explore how to leverage the capabilities of Power BI to conduct RFM analysis using the Superstore 2023 dataset from data.world, which consists of 21 columns and 9994 rows. This comprehensive dataset provides a rich source of information for extracting valuable customer insights.

What is RFM Analysis?
RFM analysis is a data-driven marketing technique that segments customers based on their transaction history. It evaluates three key metrics:
- Recency (R): How recently a customer made a purchase.
- Frequency (F): How often a customer makes a purchase.
- Monetary (M): The total amount spent by a customer.
By categorizing customers into different segments based on these metrics, businesses can tailor their marketing strategies to better meet the specific needs of each segment.
You can download the RFM segment score table to easily interpret and analyze your customer segments. Click here to download the RFM segment score table.


Data Loading
Download the Superstore 2023 dataset from data.world and load it into Power BI.
1. Get Data:
Click “Get Data” on the “Home” tab in Power BI Desktop.

2. Choose Data Source:
Select your data source (Excel, Text/CSV, Database, Web, etc.).

3. Connect to Your Data:
- Provide connection details or choose your file.
- Click “OK” or “Connect” to proceed.
4. Load Data into Power BI:
- Power BI will preview your data.
- Transform and clean if needed, then click “Close & Apply.
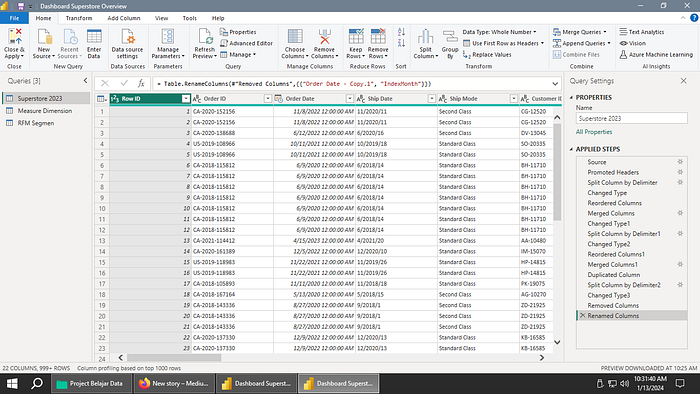
Create Date Measures
Transform the ‘Order Date’ into a Date/Time format and create measures for Last Transaction Date, R Value (Recency), F Value (Frequency), and M Value (Monetary).
LastTransactionDate = MAXX(FILTER('Superstore 2023', 'Superstore 2023'[Customer ID] = ('Superstore 2023'[Customer ID])), 'Superstore 2023'[Order Date])

R value = DATEDIFF('Superstore 2023'[LastTransactionDate], TODAY(), DAY)

F value = CALCULATE(DISTINCTCOUNT('Superstore 2023'[Order ID]), ALLEXCEPT('Superstore 2023', 'Superstore 2023'[Customer ID]))

M value = SUM('Superstore 2023'[Sales])
Create RFM Table Using DAX
- Open the “Model” view in Power BI Desktop.
- Click “New Table” on the “Model” tab.
- Enter the following DAX code:
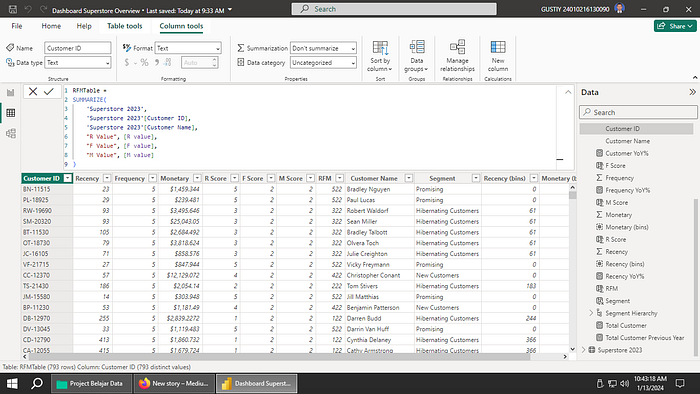
RFMTable =
SUMMARIZE(
    'Superstore 2023',
    'Superstore 2023'[Customer ID],
    'Superstore 2023'[Customer Name],
    "Recency", [R value],
    "Frequency", [F value],
    "Monetary", [M value]
)
This DAX code uses the SUMMARIZE function to create a new table named RFMTable. It summarizes the Superstore 2023 data, grouping it by Customer ID and Customer Name, and includes the calculated R Value, F Value, and M Value.
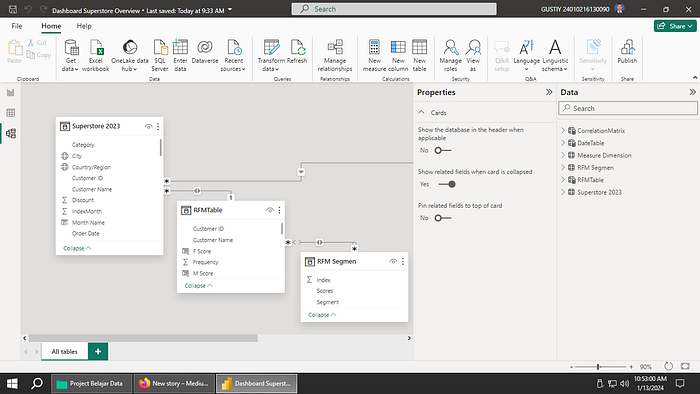
Establishing Relationships
To enrich our analysis, we need to establish a relationship between the Superstore 2023 table, the RFM Table and The RFM Segment Table. This is crucial for seamlessly integrating RFM insights into our main dataset.
- In Power BI Desktop, navigate to the “Model” view.
- Identify common fields between the Superstore 2023 table and the RFM Table, such as ‘Customer ID’.
- Drag and drop the ‘Customer ID’ field from both tables onto the canvas to create a relationship.
RFM Measures and Customer Segmentation
Categorize Recency, Frequency, and Monetary into segments and create a dynamic segmentation for each customer. Create calculated column using this DAX.
R Score = SWITCH (
  TRUE (),
   [Recency] <= PERCENTILE.INC ( 'RFMtable'[Recency], 0.20 ), "5",
   [Recency] <= PERCENTILE.INC ( 'RFMtable'[Recency], 0.40 ), "4",
   [Recency] <= PERCENTILE.INC ( 'RFMtable'[Recency], 0.60 ), "3",
   [Recency] <= PERCENTILE.INC ( 'RFMtable'[Recency], 0.80 ), "2",
   "1"
       )
F Score = SWITCH (
TRUE (),
[Frequency] <= PERCENTILE.INC ( 'RFMTable'[Frequency], 0.20 ), "1",
[Frequency] <= PERCENTILE.INC ( 'RFMTable'[Frequency], 0.40 ), "2",
[Frequency] <= PERCENTILE.INC ( 'RFMTable'[Frequency], 0.60 ), "3",
[Frequency] <= PERCENTILE.INC ( 'RFMTable'[Frequency], 0.80 ), "4",
"5"
)M Score = SWITCH (
TRUE (),
[Monetary] <= PERCENTILE.INC ( 'RFMTable'[Monetary], 0.20 ), "1",
[Monetary] <= PERCENTILE.INC ( 'RFMTable'[Monetary], 0.40 ), "2",
[Monetary] <= PERCENTILE.INC ( 'RFMTable'[Monetary], 0.60 ), "3",
[Monetary] <= PERCENTILE.INC ( 'RFMTable'[Monetary], 0.80 ), "4",
"5"
)RFM = 'RFMTable'[R Score]& 'RFMTable'[F Score]&'RFMTable'[M Score]Segment = LOOKUPVALUE('RFM Segmen'[Segment],'RFM Segmen'[Scores],RFMTable[RFM])Visualization and Analysis
Transitioning to the Report view, leverage the Power BI canvas to craft engaging visuals. Utilize charts, tables, and slicers to dynamically analyze and interpret RFM segments. This step empowers you to uncover patterns, identify high-value customers, and tailor marketing strategies accordingly.
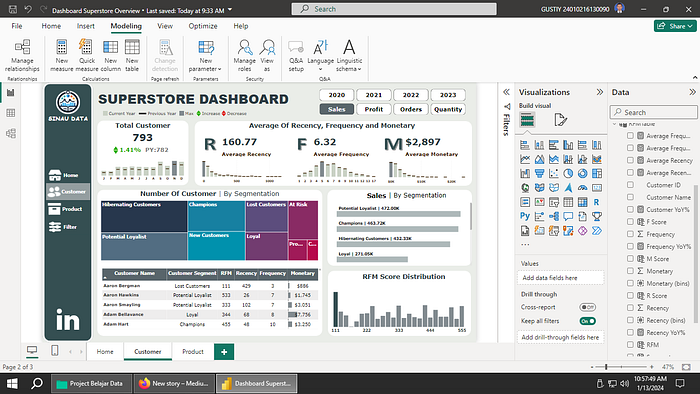
Insight From The Dashboard:
- High Potential Customers:
- Segments: Champions, Potential Loyalists, and Loyal customers.
- Insight: Focus on retaining and engaging with these segments due to their significant contribution to total sales and profit. - Engagement Opportunities:
- Segments: New Customers and Promising.
- Insight: Implement strategies to increase engagement and order frequency to maximize their long-term value. - At-Risk Customers:
- Segment: At Risk.
- Insight: Proactively address potential disengagement to prevent customer churn and sustain profitability. - Reactivation Strategies:
- Segment: Hibernating Customers and Lost Customers.
- Insight: Develop targeted reactivation strategies to re-engage with these customers and win back their business. - Small but Valuable:
- Segment: Cannot Lose Them.
- Insight: Despite a small customer base, this segment contributes significantly. Strengthen loyalty through personalized strategies.
In analyzing the RFM Customer Segmentation, a notable revelation emerges with the largest customer segment being the Hibernating Customers, encompassing a substantial 170 individuals. Despite their numerical dominance, this segment displays lower engagement levels, reflected in their modest total sales of $432,331.22 and a profit margin of $57,036.52. Alongside this, there’s a clear focus on retaining and engaging with high-value segments like Champions, Potential Loyalists, and Loyal customers.
Conclusion
In conclusion, the RFM Customer Segmentation project in Power BI equips businesses with the tools to transform raw data into actionable insights. By understanding customer behavior through Recency, Frequency, and Monetary metrics, organizations can optimize marketing strategies, enhance customer satisfaction, and drive sustainable growth.